The Economics of an iBuyer: An Opendoor Case Study
This is not investment advice and is not intended to be construed as such. The analysis is believed to be directionally accurate but could be incomplete or incorrect.
The real estate market is experiencing an unprecedented level of innovation and experimentation. Among the biggest question marks — beyond the sustainability of current prices — is the emergence of iBuyers.
An iBuyer makes an “instant offer” for a home based on its proprietary algorithms, usually as a cash offer with no showings or other hassles of selling. They take on the risk of selling the property in exchange for a service fee plus the potential upside of a higher sales price down the road.
Zillow tried to build a sustainable business but backed out in late 2021, and other big names in the market include Redfin and Opendoor. Given Zillow’s exit and the nature of the business, an obvious question is — Can an iBuyer make money? Not only that, but can they make money when the housing market isn’t red hot and appreciating month-over-month?
Who is Opendoor?
Opendoor (NASDAQ: OPEN) is a market leader in the iBuyer space. In 2021, they bought nearly 37,000 homes across 44 markets in the United States. On revenue of $8B, they lost ~$662M.
Selling to Opendoor means the homeowner has no showings, no repairs to make, no risk of financing falling through, a self-selected move date, and no real estate agent to work with. In exchange for these benefits, there’s a 5% service fee (which, in many markets, is as much or higher than the broker commissions a seller would pay) and a home inspection that identifies — and adjusts for — any repairs that are needed. That’s (pretty much) it.
Opendoor makes money by (1) Charging a service fee of 5% of the purchase price and (2) Attempting to sell the home for more than they bought it.
Given the delicate economics — a reliance on an appreciating home price — Opendoor only operates in certain markets. Recent additions like Boston, MA, Cincinnati, OH, and Albuquerque, NM join other markets like Phoenix, AZ, Raleigh, NC, and Dallas, TX (full list here; ~50 in total).
Opendoor’s competitive edge comes from it’s ability to:
Develop better pricing algorithms than its competition
Generate awareness of its service to homeowners
Convince homeowners to sell to them rather than competitors or a typical listing
The Economics of Opendoor
Public filings show that Opendoor currently operates at a loss. On ~$8B in revenue in 2021, the company lost ~$660M. It’s not unheard of to be operating at a loss at this stage of growth nor are the losses staggering. At this stage, an important question is: What are their unit economics? Are they making money on a per-home basis, and can they reasonably expect to continue making money in the future?
The company (understandably) doesn’t release this information at any level of detail or broken out by market, but property sales are public record and with those public records we can try to create baseline estimates for their activity and success in a market.
One market where Opendoor operates is Wake County, NC, home to Raleigh, NC and surrounding communities. The market is relatively lower cost than urban cores like Boston or New York, has a large (1M+) and growing population, is the state capital, and is well-aligned to capture ongoing migration trends toward Sunbelt states. Opendoor has operated in the Raleigh metro area since early 2018.
Wake County, NC on Google Maps
While this analysis is not comprehensive, there’s good reason to believe that it could be representative of general return profiles given the volume of purchases made. Opendoor appears to oftentimes use their own name as the purchasing entity and we can track these purchases by using an open-ended ‘Opendoor’ search in the data. For the purposes of this analysis, this keyword returned entities like Opendoor Property Trust I, Opendoor Property Acquisition LLC, and Opendoor Property J LLC.
It’s also very possible they make purchases under other LLCs or corporate entities that cannot be tagged as easily. Given the volume of purchases that were returned using this keyword search, it’s reasonable to assume they oftentimes use their name and we can tag these purchases (and subsequent sales) as belonging to Opendoor.
Opendoor Unit Economics in Wake County, 2021
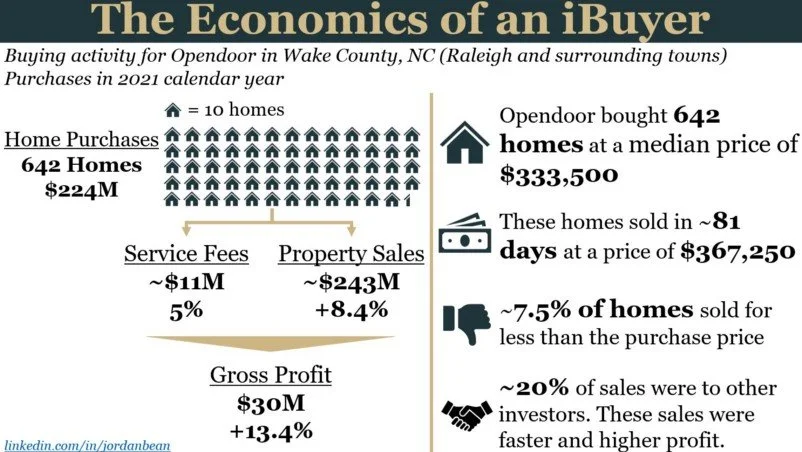
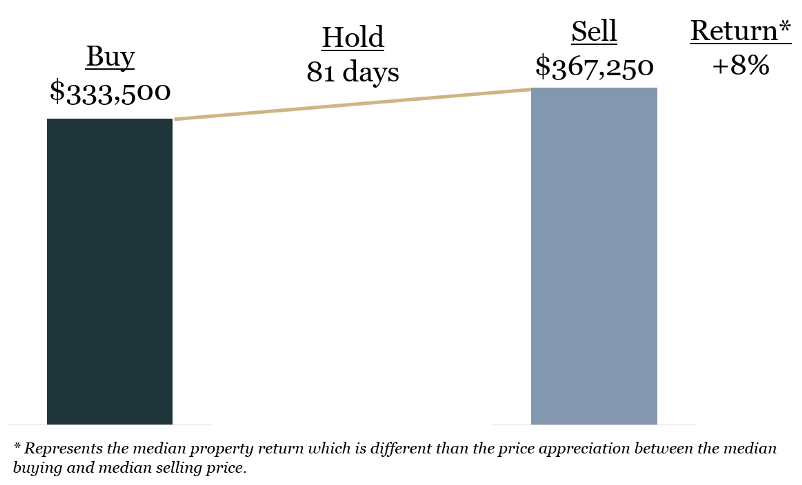
Public records indicates that Opendoor made more than 640 purchases in Wake County in the 2021 calendar year. Their typical home was bought for $333,500 and sold for $367,250 over an 81 day holding period. Their total capital investment (property purchases) was ~$224M and these properties sold for ~$243M, generating an ~8.4% return.
“Typical” purchasing and return profile in Wake County, NC for Opendoor based on public records
Opendoor also charges a flat 5% Service Fee for each home sale, so adding that onto the property appreciation yields an estimated gross profit margin of ~13.4%. Is this enough to be sustainable?
Estimates for Wake County, NC for Opendoor based on public records
For expenses, there will be ~2.5–5% in agent commissions depending on the structure of the purchase and subsequent sale. There are the proportional property taxes for their holding period, legal fees, county fees, HOA dues where applicable, lawn & exterior maintenance, unexpected repairs, utility costs, staging or home preparation, and other miscellaneous expenses. This is before even considering their corporate employees & overhead expenses.
I don’t have an estimate for the above expenses, but the direct cost of buying and selling a home is not insignificant.
Every once in awhile, the company misjudges the fair market value for the home. About 7.5% of purchases sold for less than the purchase price (this does not include an adjustment for their 5% service fee). Homes that lost money typically took over 130 days (4+ months) to sell. Interestingly, these also tended to be higher priced homes. The median sale price (despite losing money) was just under $400K compared to about $364K for homes that sold above the purchase price.
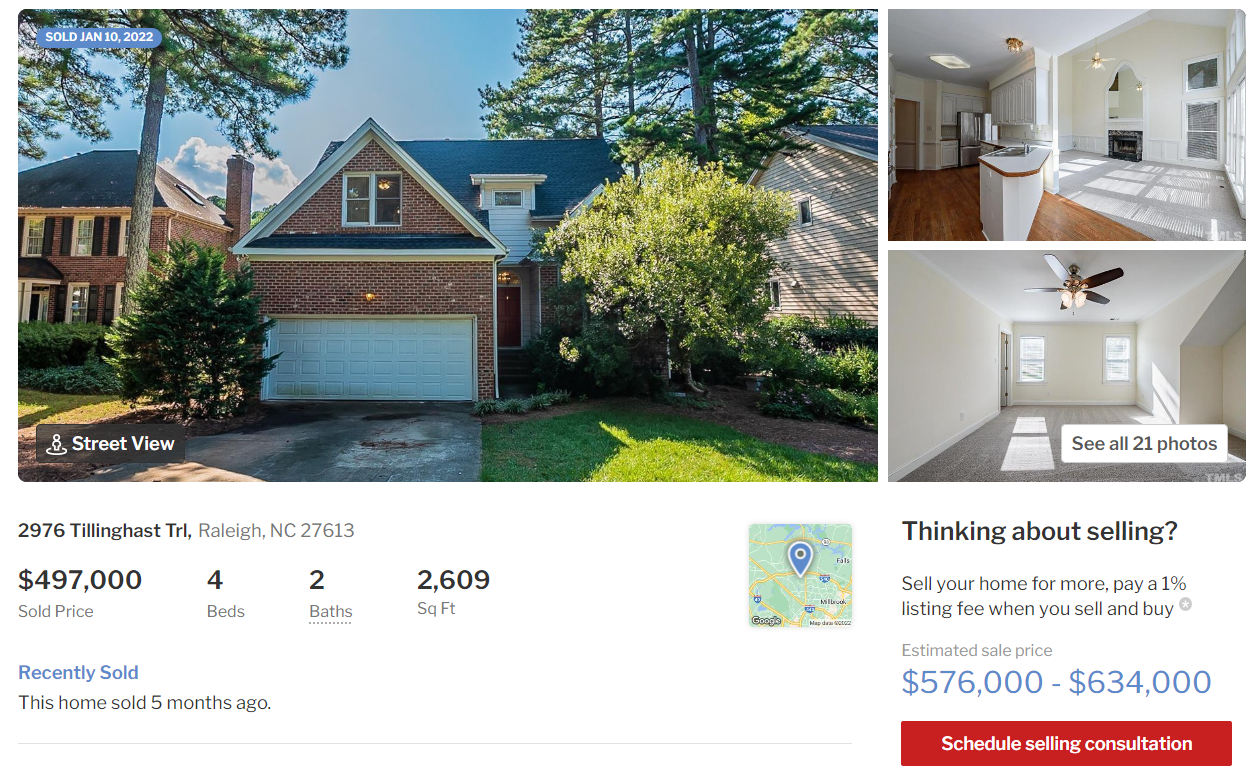
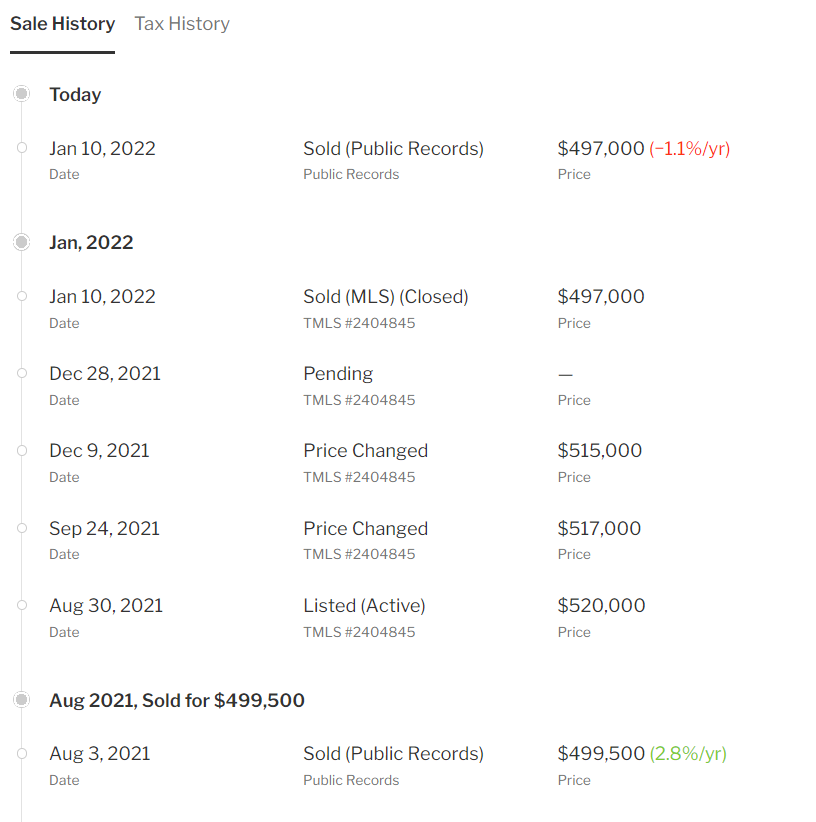
Example screenshots from Redfin for an Opendoor-purchased home that lost money
Above is an example of a home that lost money. Opendoor bought the home on August 3rd for $499,500. The home was listed 27 days later for $520,000 — about 4% above their purchase price. After two subsequent price cuts, the home sold below asking and $2,500 below their purchase price after 160 days on the market.
This is bound to happen, and no doubt the data scientists are hard at work figuring out why a property is mispriced and how to correct for it in the future.
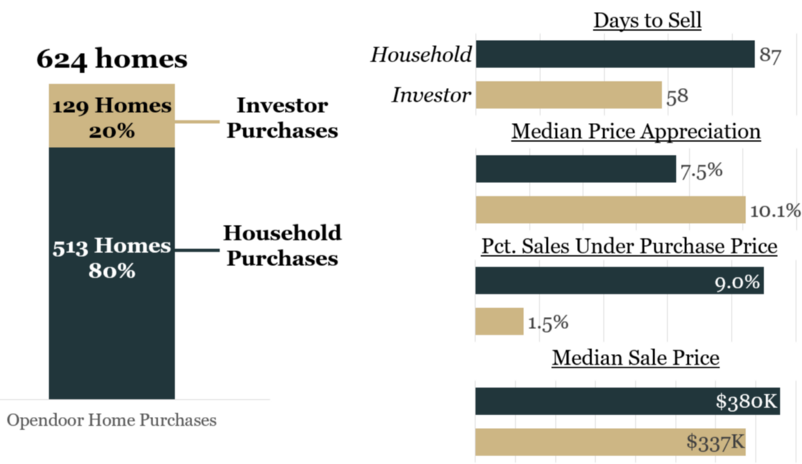
One other interesting fact in the data is that — based on my best estimate — about 20% of these properties were sold to other investors. These are most likely investors looking to buy-to-rent rather than buy-to-sell. An example might be FirstKey Homes, my best guess for a buyer that frequently appears under some variant of FKH SFR PROPCO G LP.
Home sales to investors sold almost 30 days faster than those to individuals (likely a result of a cash sale instead of a financed sale), had a higher return on investment (~10% median property price appreciation vs. ~7.5% for households), and were much less likely to sell at a loss (~1.5% of sales compared to 9% for households).
Investor vs. Household purchasing profile for Opendoor sales in Wake County, NC
It seems to me like this represents a significant source of buyer interest for sales in Wake County. What does it say about a market when such a significant number of homes are bought by an investor, then 1 in 5 of those purchases is re-sold to another investor?
The Long-Term View
For the sake of argument let’s say my estimate of ~13.5% gross return for property sales and service fee is close to the truth for Wake County. Maybe it’s not — I certainly don’t have the full picture — but it seems within the realm of possibility. The question becomes: Is this sustainable?
Let’s remember that home prices have never appreciated in value as fast as they did in 2021, or at least not in the modern era. Given this context, it’s hard to believe that an 8%+ price appreciation in less than 3 months is a reasonable assumption to make going forward.
Again, I don’t know their cost structure other than what’s publicly available that the company is losing money, but if you lose money in the best market you’ll ever experience, what is the path to profitability? Surely some of those expenses relate to expansion, growth, setting up new markets, investing in new technology, and other long-term strategic initiatives. I just wonder whether it’s possible to achieve profitability with lower expected price appreciation moving forward.
It seems that as this market settles, and as the residential real estate market cools, one or both of their revenue levers will have to change. The Service Fee will have to be higher and/or their offers will need to be lower relative to the market value. Will homeowners accept a 10% discount to market given how much their home has appreciated in the past few years for the convenience of selling to Opendoor? 5%? 15%?
The math just doesn’t work if they offer the market value for a home, and determining the right discount rate that sellers will accept, plus will make them profitable, is certainly an interesting calculation (no doubt this is something they’re testing since they provide no-obligation offers to sellers and can see whether someone moves forward).
One other risk factor to call out is the audience of investor buyers. If investors choose to pause investing in residential real estate, are there 10% or 20% more households that will buy Opendoor’s properties? Will they buy it as fast, for as much money? The percentage of investors buying Opendoor’s properties doesn’t appear to meaningfully differ from the broader open market in Wake County, but it seems to be a risk factor worth pointing out.
Return profiles will vary by market, as will costs, buyer profile, and brand reputation. My estimates might be close or very far off. Opendoor doesn’t release information by market, so we’re left to make our best guesses based on the information available. The residential real estate market is experiencing innovation and experimentation just like other industries, and I’ll be curious to see how the iBuyer experiment plays out.


