Identifying Hot Spot Real Estate Areas with Analytics
Wouldn’t you love to turn back the clock and invest in the right real estate at the right time? I’m in the fast-growing city of Raleigh, North Carolina, and in the past 5 years the median property value in my zip code has doubled in value. Unfortunately, I wasn’t in the market (or even in the city) five years ago, so that trend has long passed me by.
But, the thing about a fast growing city is that developers are always looking for what’s next. Where should they build up or build out to capitalize on high-value areas? Are there patterns we can identify that can give an edge to see where people will (or should) go next?
Example columns from the permit data relevant to the analysis
To create a standard unit of geography, I mapped every permit address to a Census Block Group (read more on block groups here — they’re the most granular geography where rich data is published from the US Census and are more precise than zip codes). This allows us to see, on a detailed and consistent basis, how permit value shifts over time by grouping at the census block group level for each year, then visualizing the results.
Example Census Block Groups where darker blue means higher estimated permit value
This data is best viewed over multi-year time horizons because of the time it takes to (ironically) acquire permits and to respond to the longer cycles of real estate development. We’d expect variation from year-to-year, so I grouped the data into two-year buckets (2010 and 2011, 2012 and 2013, and so forth).
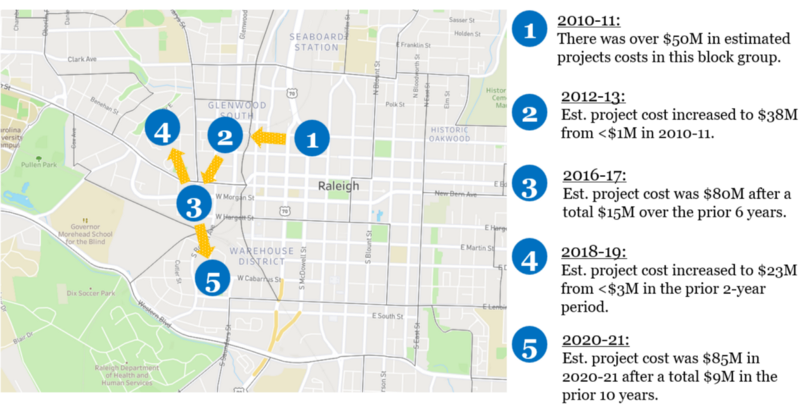
What I found most interesting was looking for areas with momentum and its impact on surrounding neighborhoods. Consider the below example in the evolution of a pocket of block groups in downtown Raleigh.
Example of areas gaining momentum from nearby investment
Downtown Raleigh has had sustained investment over the past decade, and we can measure the impact on the immediate surrounding areas.
Starting at the (1) circle above, there was $50M of estimated project costs issued in calendar years 2010 and 2011.
In the following 2-year period (2012–13), a neighboring block group (circle 2) increased to $38M in est. project costs, up from <$1M in the prior period.
Fast forward two periods and in 2016–17, the block group to the south (circle 3) had over 5x higher project costs in the two year period than the prior 6 years combined.
In 2018–19, development moved north to circle 4 where project costs were up 10x from the prior 2-year period and equal to the value of the past 8 years combined
Finally, move south from circle 3 to circle 5 where project costs in the 2020–21 period were almost 10x the value of the whole prior decade.
We can use the permit data to track this step-by-step change and plot the evolution of how investment works its way through neighborhoods and cities.
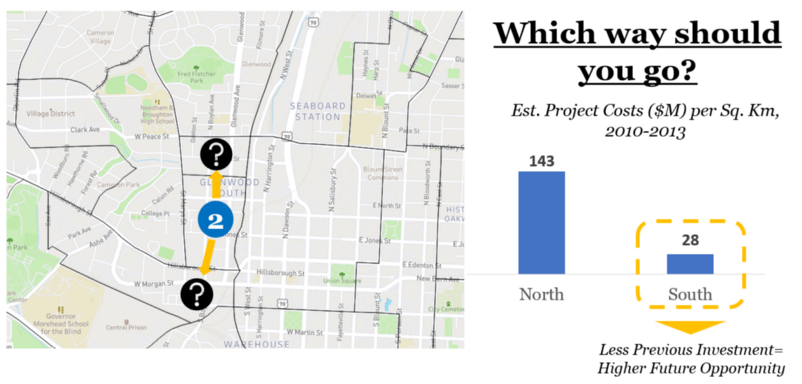
In theory, at each subsequent step, investment can go in any (or no) direction. A plausible question is — Why did it follow the path that it did? For example, why did development move south from circle 2 instead of north starting in 2014?
The most probable answer in this case is that the area to the north was already more developed. Over the 4-year period from 2010–2013, the investment (estimated project costs) per square kilometer was over 5x higher in the block group to the north compared to the south. In other words, the area to the south presented more remaining opportunity, so that became the next step in the chain.
Development between 2010–2013 was 5x higher north, so we can hypothesize that development moved south because there was more remaining development opportunity
If we’re trying to predict where to go next, we can start to develop key questions based on these findings. We can ask…
Where is there high development, landmark projects, and/or sustained multi-period momentum?
Which nearby areas (block groups) have lower relative development over previous years?
What is the composition of the neighborhood (commercial, residential — single family or apartments, mixed use) as it relates to a developer’s core project type?
Development is — to put it simply — a function of residential & commercial demand, land availability (empty lots, rebuilds, etc.), zoning, and cost. When you’re early to an emerging area, you have lower cost and higher land availability, but less certain demand. Later in the maturity you have more certain demand but less availability with higher cost. It’s a complex and fascinating tradeoff to see who can make the right bet on the right neighborhood.
All else equal, it makes sense to continue to develop in areas that have already proven to be successful and profitable. Over time, though, space simply runs out. Nearly everything that can be developed is developed, and the logical place to go is the immediate bordering area.
As an example, for nearly a decade, the 3 block groups that comprise true downtown Raleigh were among the highest investment areas in the city, but by 2020–21, activity moved south of downtown as the next investment frontier because the most obvious and available lots for development were…developed.
The core downtown census blocks had between $160M-$1B project costs per square kilometer in the 2010–2021 time period, while the newly shaded blue areas below have between $3M-$117M. If you’re looking for growth in two side-by-side census block groups, I’d take the one currently at 1/10th the invested value.
Project costs moved south after a decade
So, how do you identify where development is moving next? The surest bet — if there is such a thing (there isn’t)— is to focus on moderate to high investment block groups, look back in the data 10–15 years to determine previous investment activity (project cost controlled for size) in neighboring block groups, determine the neighborhood characteristics (all built single family homes, empty parking lots, nearby 10+ story buildings), and make an informed guess about which direction makes the most sense.
Sometimes this might be a “follow the leader” situation and other times it means going on the edges of current development areas.
Following the leader means anchoring to a large development in a new area. For example, in Raleigh, the North Hills neighborhood has been completely transformed by tremendous investment in a new live-work-play series of developments (block 1 below). Since the beginning of the development, neighboring block groups (2 and 3) have already seen higher investment in the subsequent 4 years since the development was underway than the previous 8.
Example of the halo effect of a large development in a new area of Raleigh
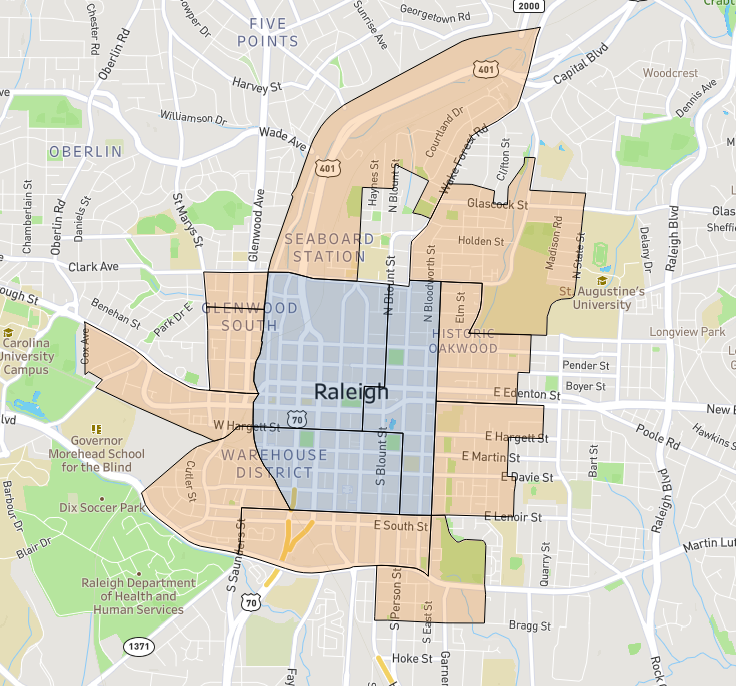
For areas with sustained decade-long investment like downtown Raleigh, it’s more a question of how early are you willing to be or how long are you willing to wait? Every census block group but one that shares a meaningful border (orange) with the downtown (blue) has been in the top third of investment at some point over the past decade, but at different times. It’s not a matter of “if” but “when” for areas that have demonstrated long-term staying power.
Blue are the three core downtown block groups. Block groups in orange were in the top third of investment (project cost) at least once in the past decade. The one that didn’t has a University sitting on part of the land.
This approach works for Raleigh because there’s an estimated project cost and history of publishing data. In other cities the data might take a different form, so relying on volume of permits might be more relevant than estimated value.
Like anything that involves looking to the future, working with permit data can provide us with an informed best guess but not a guaranteed prediction. Real estate is as much art as science. At the end of the day, the best place to develop might be the only place available to develop, but we can use analytics to understand — at scale — where it has happened, and what that suggests about where it could go next.


